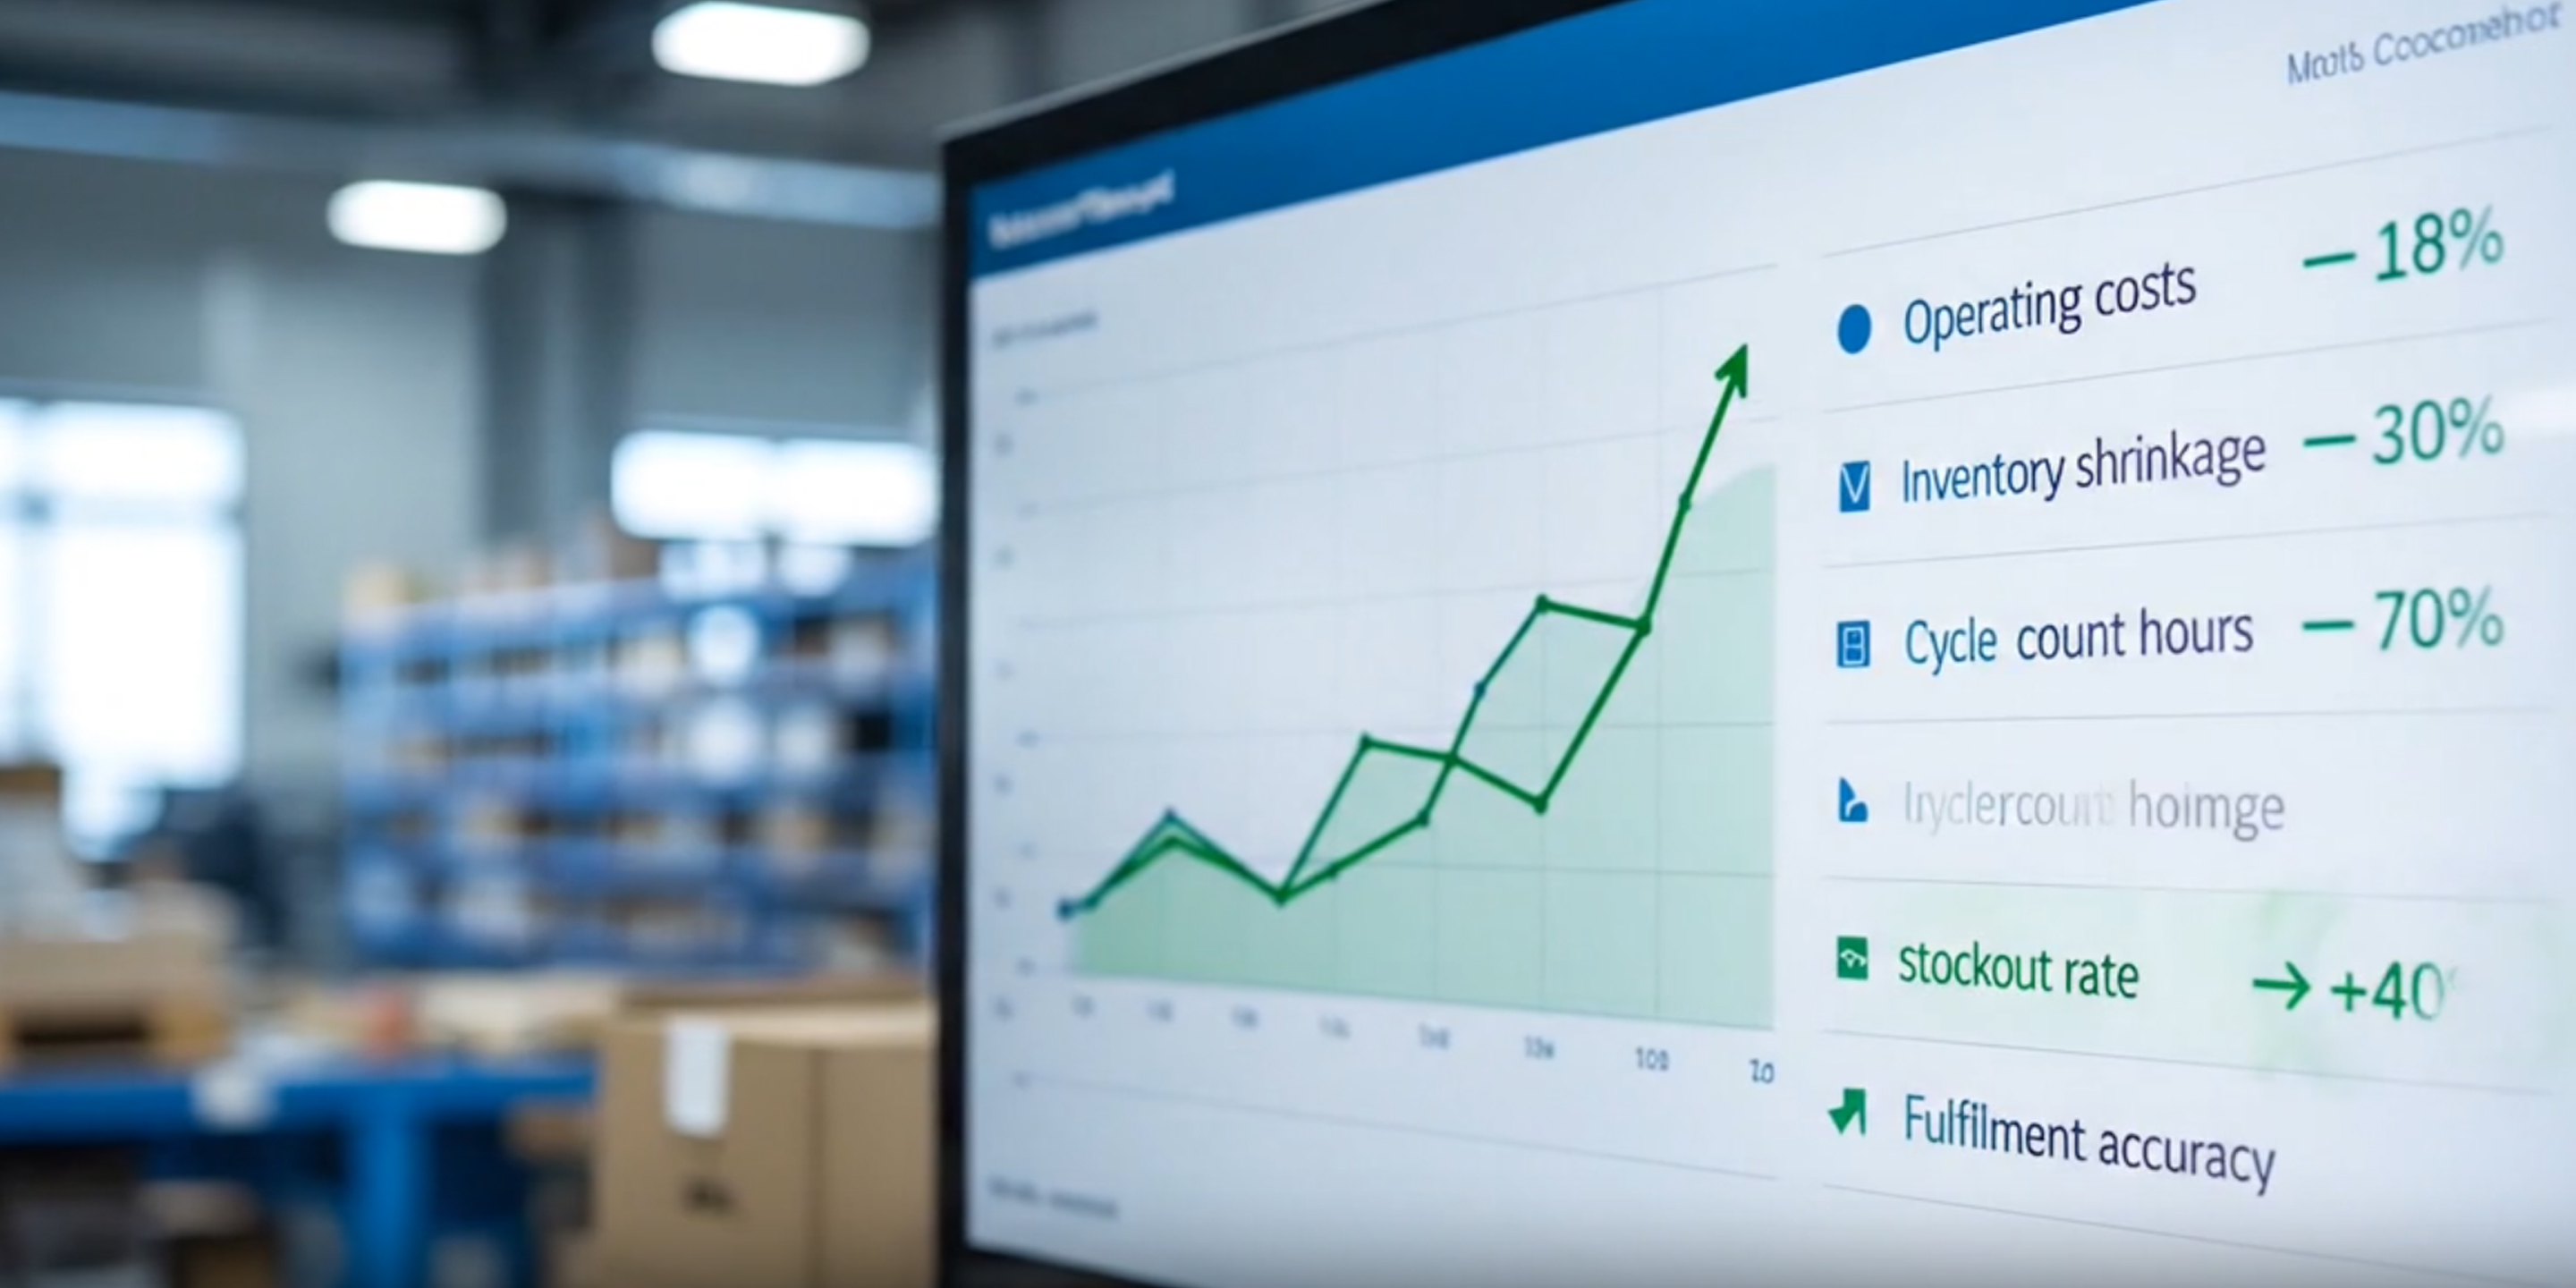
ROI Calculator
Enter your facility parameters below and see a detailed breakdown of labour savings, cycle count reduction, pick error elimination, and shrinkage recovery — plus the impact of Canada's Productivity Super-Deduction on your net cost.
Methodology
Each factor in the model is grounded in published industry benchmarks for warehouse and distribution operations. The variables you enter — facility size, operation type, location, and shift pattern — are applied against these benchmarks to generate your specific estimate. Results may vary ±30% depending on your existing processes, SKU complexity, and current accuracy baseline.
Canada's Productivity Super-Deduction
Canada's 2025 federal budget introduced a significant capital incentive that materially improves the financial case for deploying KolaTM. For Canadian operations, this is enacted legislation — not a projected or anticipated benefit — and it creates a defined window that closes progressively after 2029.
Bill C-15, which received Royal Assent and came into force in March 2026, introduced the Productivity Super-Deduction as a new accelerated Capital Cost Allowance mechanism. Under existing CCA rules, technology assets are typically depreciated at 45–55% declining balance over several years — meaning the full tax benefit of a capital purchase is spread across five or more years. The Super-Deduction eliminates this deferral for qualifying assets.
Qualifying businesses can now deduct 100% of the capital cost of eligible assets in the year they are placed in service. This is a full immediate write-off — not enhanced accelerated depreciation, but complete Year 1 recognition of the entire capital expenditure.
KolaTM installations qualify directly. The legislation explicitly identifies computers, data network infrastructure, and AI tools as qualifying asset categories under the productivity-enhancing assets definition. A KolaTM system — comprising sensor hardware, edge compute nodes, and the connected SaaS platform — falls squarely within this definition.
Consider a 100,000 sq ft retail distribution facility in Ontario. The hardware installation cost under KolaTM pricing is approximately $541,000 ($5.11/sq ft). The SaaS subscription of $48,000/yr is an operating expense and is already fully deductible annually — no election required.
Under traditional CCA (Class 10 at 30% declining balance), Year 1 tax savings on the hardware would be approximately $43,000, declining each year thereafter. The total tax savings over five years would be approximately $143,000 — but spread unevenly across the period.
Under the Super-Deduction, the entire $143,000 tax benefit is captured in Year 1 — reducing the effective net cost of the installation to approximately $398,000 before a single dollar of operational savings is counted. This single-year recognition fundamentally changes the payback calculation. At an estimated net annual saving of $265,000 for that facility, the tax-adjusted payback period is approximately 18 months rather than the unadjusted 24 months.
| Year | Traditional CCA (Class 10, 30%) | Super-Deduction (100% Year 1) |
|---|---|---|
| Year 1 | ~$43,000 tax savings | ~$143,000 tax savings |
| Year 2 | ~$30,000 tax savings | — |
| Year 3 | ~$21,000 tax savings | — |
| Year 4 | ~$15,000 tax savings | — |
| Year 5 | ~$10,000 tax savings | — |
| 5-Year Total | ~$119,000 | ~$143,000 — Year 1 only |
Tax figures based on a 26.5% combined federal/Ontario corporate rate. Consult your tax advisor for your specific provincial rate and asset classification.
The full 100% deduction is available for qualifying assets placed in service on or before December 31, 2029. After that date, the deduction steps down on the following schedule:
| Year Asset Placed in Service | Deduction Rate | Approximate Year 1 Tax Saving (100K sq ft example) |
|---|---|---|
| 2026 – 2029 | 100% | ~$143,000 |
| 2030 | 75% | ~$107,000 |
| 2031 | 50% | ~$71,500 |
| 2032 | 25% | ~$35,700 |
| 2033 and beyond | Standard CCA | ~$43,000 (declining balance) |
Operations that deploy within the current full-benefit window capture a tax advantage that is materially larger than anything available after 2029. For procurement committees evaluating timing of a KolaTM deployment, this schedule is a concrete financial argument for proceeding before year-end 2029.
The SaaS subscription ($0.48/sq ft/yr, capped at $120,000 annually) is treated as a fully deductible operating expense each year under standard income tax treatment — no special election or CCA classification required.
Tax figures are estimates based on a combined federal/Ontario corporate rate of 26.5%. Actual rates vary by province and corporate structure. Consult your tax advisor. This is not tax advice.
Ready to take the next step?
We can run a detailed ROI analysis specific to your facility — including a tax-adjusted deployment scenario and a phased rollout cost model. No commitment required.
 647-367-9233
 954-900-8811